1. Overview
JesterMap is a Windows PC program used to display the tracks and logs of boats engaged in ocean challenges. Its input is a file of position reports which can be prepared on a spreadsheet. Its output is a map definition file which can be displayed using Google Earth or Google My Maps.
Google My Maps can be embedded on web pages, including wordpress, without the need for Google API keys or wordpress plugins.
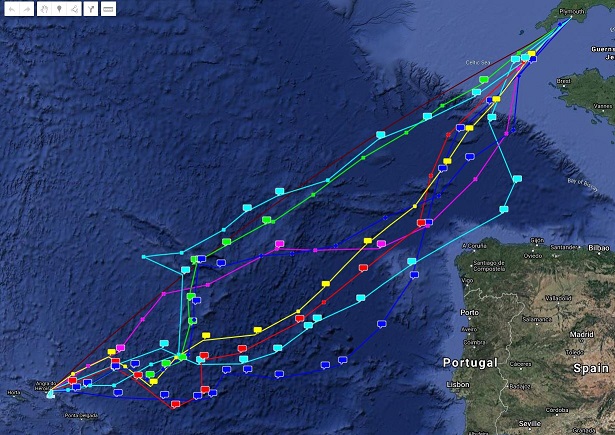
Although the program could be used for short events it is intended for displaying daily positions and logs rather than more fine grained track information. Each position in the resulting map is marked with an icon, even if a log is not available.
The resulting map is active, it can be zoomed/panned etc, log entries can be displayed and tracks can be selected for individual boats.
A position report is a single line in a .csv file (jester_tracks.csv) which can be created using a standard spreadsheet program:

The program accepts a wide range of different date, time, and position formats, it should be possible to simply cut and paste this information from other position reporting systems. The order that lines are put in the spreadshet doesn’t matter, the entries for each boat are displayed in date and time order.
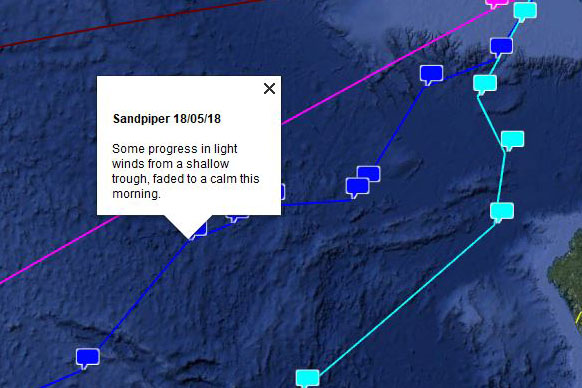
The status and log fields are optional. The status field allows text to be added to the log caption which is also displayed on the map for the current position. In the photo below ‘Retired’ has been added as a status at the final position; this could be used for other short text if required, for example to display time.
